Initiating Coverage | Plywood
November 28, 2017
Century Plyboards India
BUY
CMP
`317
Century Ply for enduring returns
Target Price
`400
Century Plyboards India Ltd (CPIL) is a plywood manufacturer dealing in plywood,
Investment Period
12 Months
laminates, MDF (Medium Density Fibreboard) and others with presence across India
and overseas. CPIL is also engaged in logistics business through management of a
Stock Info
container freight station.
Sector
Plywood
Market Cap (` cr)
7,115
Shift in trend towards organized plywood sector to propel growth: Indian plywood
Net Debt (` cr)
545
industry is estimated at `18,000cr and is largely unorganised (~75% share of
Beta
1.0
revenues). However, with the implementation of GST, the share of organized players is
52 Week High / Low
320/154
expected to improve, which would be beneficial for branded players like CPIL. Hence,
Avg. Daily Volume
50,190
we believe that CPIL is best placed to gain market share on the back of better product
Face Value (`)
1
quality, strong brands and wide distribution network. Currently, the company has
BSE Sensex
33,724
~25% market share in the organized plywood industry.
Nifty
10,400
Reuters Code
CNTP.BO
Capacity addition across segments to drive growth: CPIL has recently added new MDF
Bloomberg Code
CPBI.IN
plant (1,98,000 cubic metre, to generate ~`450-500cr revenue), laminates (4.8
million sheets by scaling ~50%, to generate ~`250-300cr revenue), particle boards
Shareholding Pattern (%)
(`100cr of revenue). Capacity addition across segments would boost company’s
Promoters
72.0
revenue and profitability going ahead.
MF / Banks / Indian Fls
3.7
Pradhan Mantri Awas Yojana - trigger for Plywood & MDF segment: The government’s
FII / NRIs / OCBs
12.8
Indian Public / Others
11.4
aim to build ~1.2cr houses by 2022 under Pradhan Mantri Awas Yojana (PMAY)
would increase demand for plywood industry (for making doors & furniture). Hence,
demand for Plywood & MDF would witness an uptick.
Abs.(%)
3m
1yr
3yr
Sensex
6.2
28.0
18.6
Strong brand visibility with wide distribution network: CPIL has been continuously
CPIL
13.6
66.3
128.2
focusing on strong brand visibility, by spending 3-4% (% of sales) on ad spends to
increase brand visibility. CPIL’s products are available across the country through 31
marketing offices covering over 630 cities and towns addressing 1,800 dealers and
3-year price chart
~16,500 retailers.
350
Outlook & Valuation: We expect CPIL to report net revenue CAGR of ~17% to
300
~`2,896cr over FY2017-20E owing to healthy growth in plywood and lamination
250
business, foray into MDF and particle boards coupled with strong brand and
200
distribution network. On the bottom-line front, we expect CAGR of ~16% to `306cr
150
over the same period on the back of strong revenue and better margin in MDF
100
business. At the current market price of `317, the stock trades at a P/E of 23.3x its
50
0
FY2020E EPS of `13.7. We initiate coverage on the stock with a Buy recommendation
and Target Price of `400 based on 29x FY20E EPS, indicating an upside of ~26%
from the current levels.
Source: Company, Angel Research
Consolidated Key financials
Y/E March (` cr)
FY2017
FY2018E
FY2019E
FY2020E
Net sales
1,819
2,007
2,510
2,896
% chg
10.8
10.4
25.1
15.4
Net profit
193
188
248
306
% chg
14.0
(2.9)
31.9
23.4
EBITDA margin (%)
17.2
17.5
17.9
18.1
Amarjeet S Maurya
EPS (`)
8.7
8.4
11.1
13.7
022-39357800 Ext: 6831
P/E (x)
36.8
37.9
28.7
23.3
P/BV (x)
10.0
8.1
6.6
5.3
RoE (%)
27.1
21.3
22.9
22.9
RoCE (%)
18.9
17.1
20.2
21.3
EV/Sales (x)
4.2
3.9
3.1
2.7
EV/EBITDA (x)
24.6
22.4
17.4
14.9
Source: Company, Angel Research, Note: CMP as of November 27, 2016
Please refer to important disclosures at the end of this report
1
Century Plyboards India| Initiating Coverage
Key investment arguments
Shift in trend towards organized plywood sector to propel growth:
The Indian plywood industry is estimated at `18,000cr and is largely unorganised
in nature with informal players accounting for ~75% share of revenues. This
includes all categories like premium, mass market and low-end plywood.
Going forward, we believe that the share of the organised sector would increase at
a fast pace owing to the shift in market trend from the unorganized to the
organized sector. With the implementation of GST, the pricing gap between the
organized and unorganized players is expected to reduce, which would make the
pricing of organized players equally attractive, and hence the consumer sentiment
would favour the products from organised sector. The share of organized players
is expected to improve from current levels, which in turn would be beneficial for
branded players like CPIL.
Exhibit 1: Break-up of Plywood market in India
Total Plywood Market
Premium Plywood Mass plywood
Low-end Plywood
Total
18,000
3,600
9,000
5,400
Organized
4,500
2,520
1,350
-
Unorganized
13,500
1,080
7,650
5,400
Last 5 years CAGR
12%
5-7%
Flat/de-growth
Started tapping through MDF
(Segment has not grown in the
Century Market
Presence
Presence
past five years due to shift
from low-cost ply to MDF)
Source: Company, Angel Research
Hence, we believe that CPIL is best placed to gain market share on the back of
better product quality, strong brands and wide distribution network. Currently, the
company has ~25% market share in the organized plywood industry.
Strong brand visibility with wide distribution network
CPIL has been continuously focusing on strong brand visibility of its products. The
company offers plywood, laminates, veneers, MDF, block boards, doors, fibre
cement boards and particle boards. Historically, the company has been spending
around 3-4% (percentage of sales) on ad spends to increase its brand visibility.
Currently, CPIL’s products are available across the country through 31 marketing
offices covering over 630 cities and towns addressing 1,800 dealers and nearly
16,500 retailers. The products are available across Tier-I, Tier-II and Tier-III
locations. The dealers and retailers are serviced through
40 depots and
warehouses.
November 28, 2017
2
Century Plyboards India| Initiating Coverage
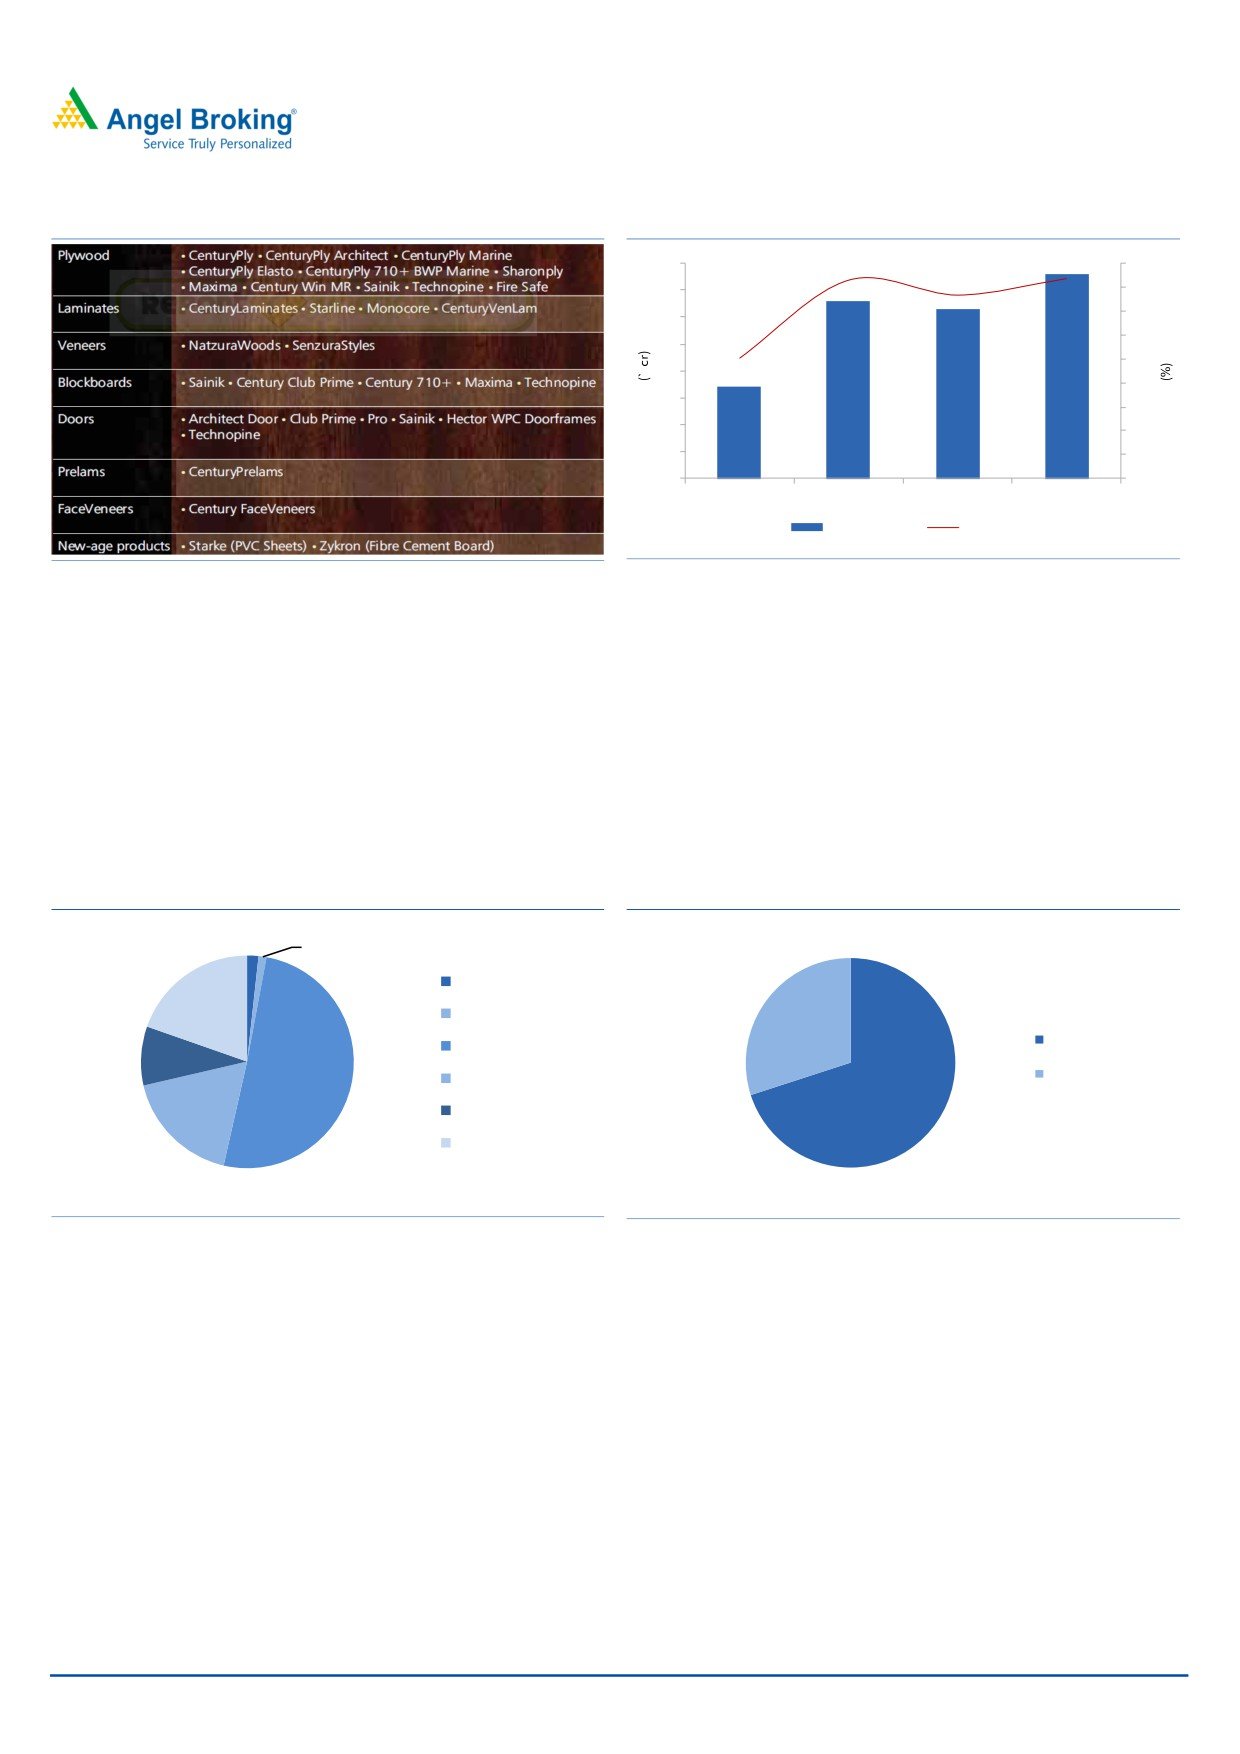
Exhibit 2: CPIL Brands
Exhibit 3: Significant increase in ad spends
80
4.1
4.2
4.5
3.8
70
4.0
3.5
60
2.5
3.0
50
2.5
40
76
2.0
66
63
30
1.5
20
34
1.0
10
0.5
0
0.0
FY14
FY15
FY16
FY17
Advertisement
% to sales
Source: Company, Angel Research
Source: Company, Angel Research
Capacity addition in MDF, Particle boards & Laminates segments
MDF: CPIL has recently added new plant of MDF plant in Punjab with a capacity of
1,98,000 cubic metre (which will be able to generate `450-500cr revenue and
operating margin in the range of
20-25%). The plant has been already
operational in November 2017. The company plans to manufacture value-added
products such as laminated MDFs, flooring and doors, among others from this
plant. Consequently, management is hopeful of generating revenues in the range
of 150-200cr in the current financial year.
Exhibit 4: Current capacity of various players
Exhibit 5: MDF demographic break-up
17,000
12,000
1,98,000
Mangalam Timber
30%
Shirdi Industries
Domestic
Action Group
90,000
Greenply Industries
Import
5,11,000
Rushil Decor
Century Ply
70%
1,80,000
Source: Company, Angel Research
Source: Company, Angel Research
Particle boards: CPIL commissioned a
54,000 cubic metre particle board
manufacturing facility at a capex of
`60cr in FY2017. The location was
strategically chosen to be Chennai, as ~50% of the raw material requirement was
accessed from a captive unit in the vicinity of the plant and the rest from third party
units located in the hinterland. The plant can potentially generate `100cr of
revenues while operating at peak capacity.
November 28, 2017
3
Century Plyboards India| Initiating Coverage
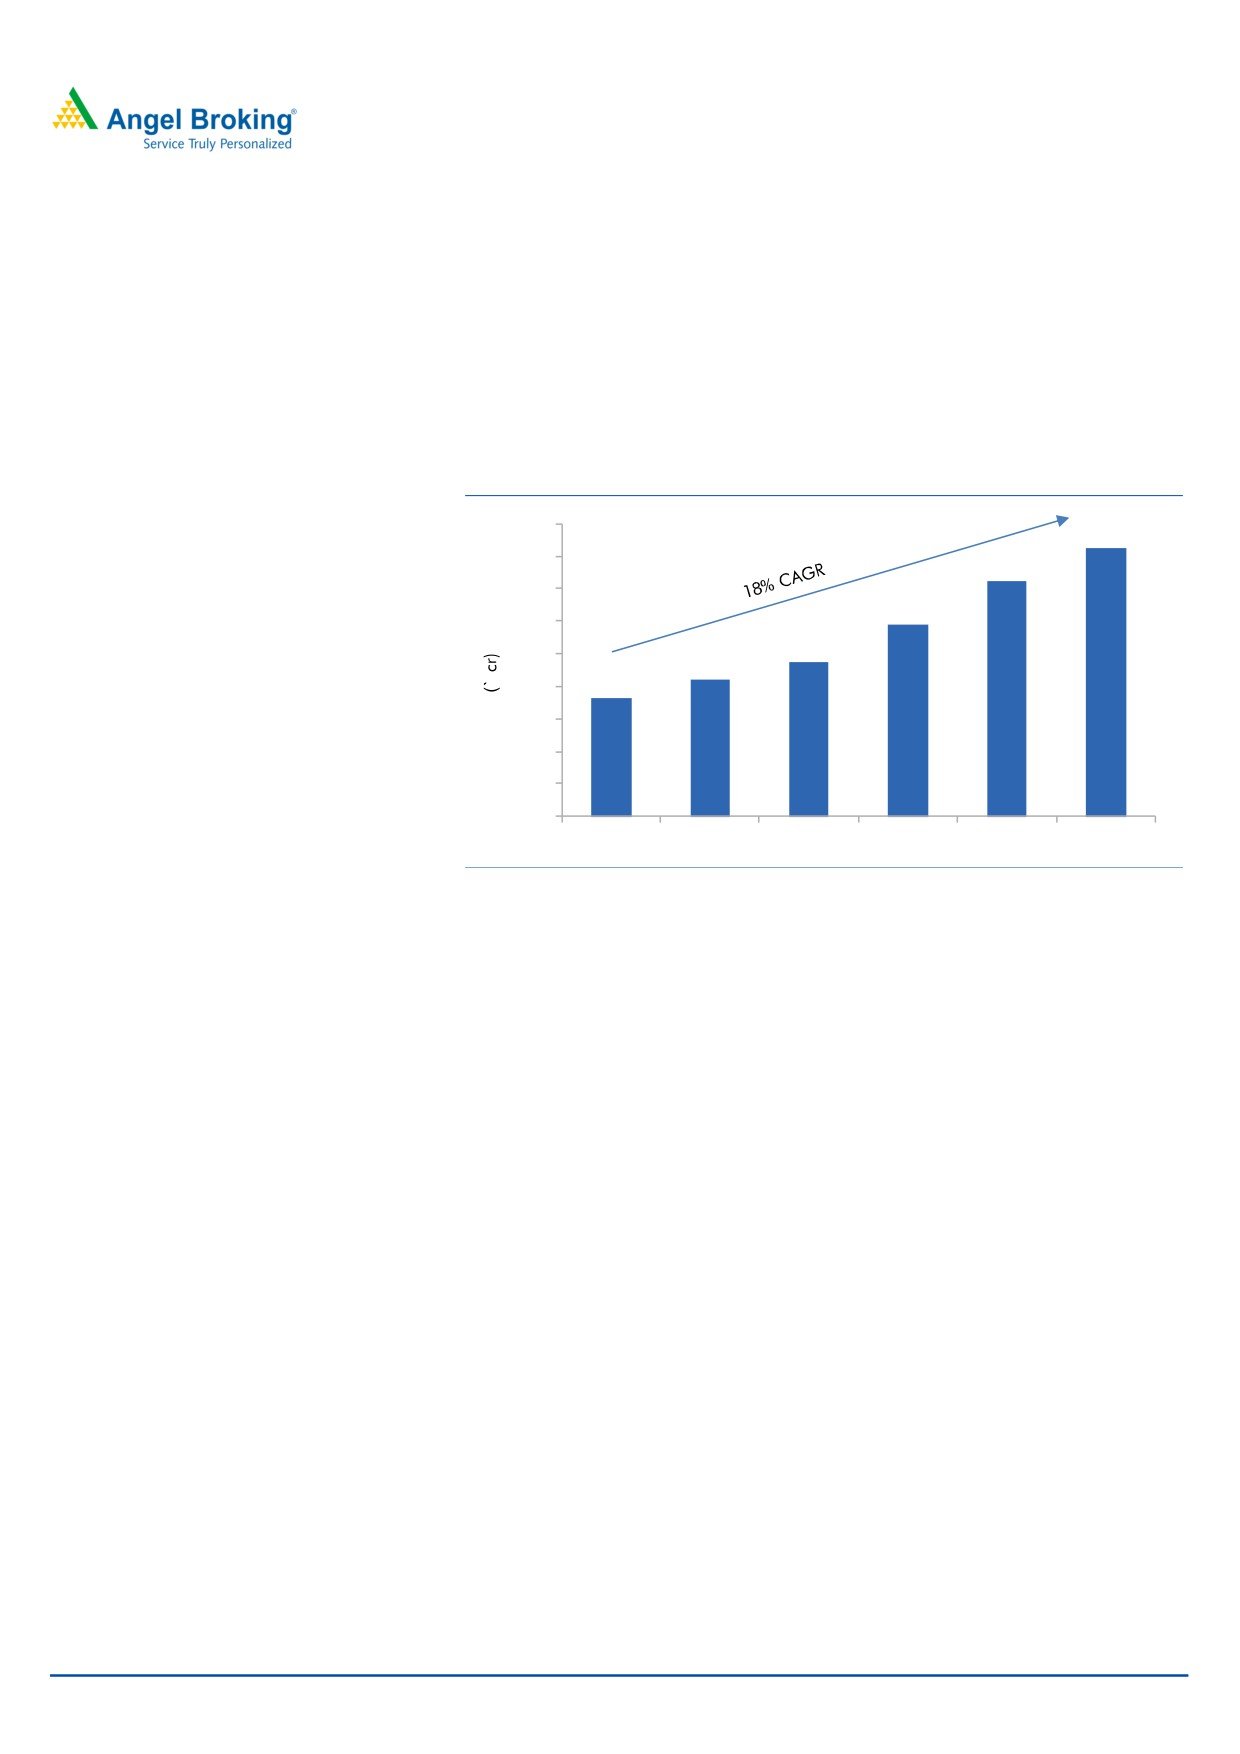
Laminates: In this segment, the company has reported revenue CAGR of ~18% in
the last 5 years and expects strong revenue growth going ahead on the back of
strong brand and distribution network. The company has doubled its laminate
production capacity to 4.8 million sheets by scaling up to 50% in September 2017
in order to capture incremental demand. CPIL also has 650 SKUs, adding 100
odd designs a year. By doing so, CPIL is not only addressing the largest segment
(1.0 millimetre thickness laminates) but also value added segments (textured and
exterior laminates).
Exhibit 6: Historical strong growth performance of laminate segment
450
412
400
362
350
294
300
237
250
211
182
200
150
100
50
0
FY2012
FY2013
FY2014
FY2015
FY2016
FY2017
Source: Company, Angel Research
Healthy revenue growth and higher margin in container freight station to boost
profitability
The company entered the container freight station (CFS) business by acquiring
0.1m sq mt of Kolkata Port Trust land, which has a total capacity of 160,000 TEUs
spread across its two CFS at Sonai (40,000 TEUs) and Jingira Pool (120,000
TEUs). In this segment, the company has reported revenue CAGR of ~10% in last
4 years. On EBITDA margin front, the company has reported more than 24%
margins in the last 4 years. Considering the company’s historical track records, we
expect the same growth trajectory to continue going ahead.
November 28, 2017
4
Century Plyboards India| Initiating Coverage
Outlook and Valuation
We expect CPIL to report net revenue CAGR of ~17% to ~`2,896cr over FY2017-
20E owing to healthy growth in plywood and lamination business, foray into MDF
and particle boards coupled with strong brand and distribution network. On the
bottom-line front, we expect CAGR of ~16% to `306cr over the same period on
the back of strong revenue and better margin in MDF business. At the current
market price of `317, the stock trades at a P/E of 23.3x its FY2020E EPS of `13.7.
We initiate coverage on the stock with a Buy recommendation and Target Price of
`400 based on 29x FY20E EPS, indicating an upside of ~26% from the current
levels.
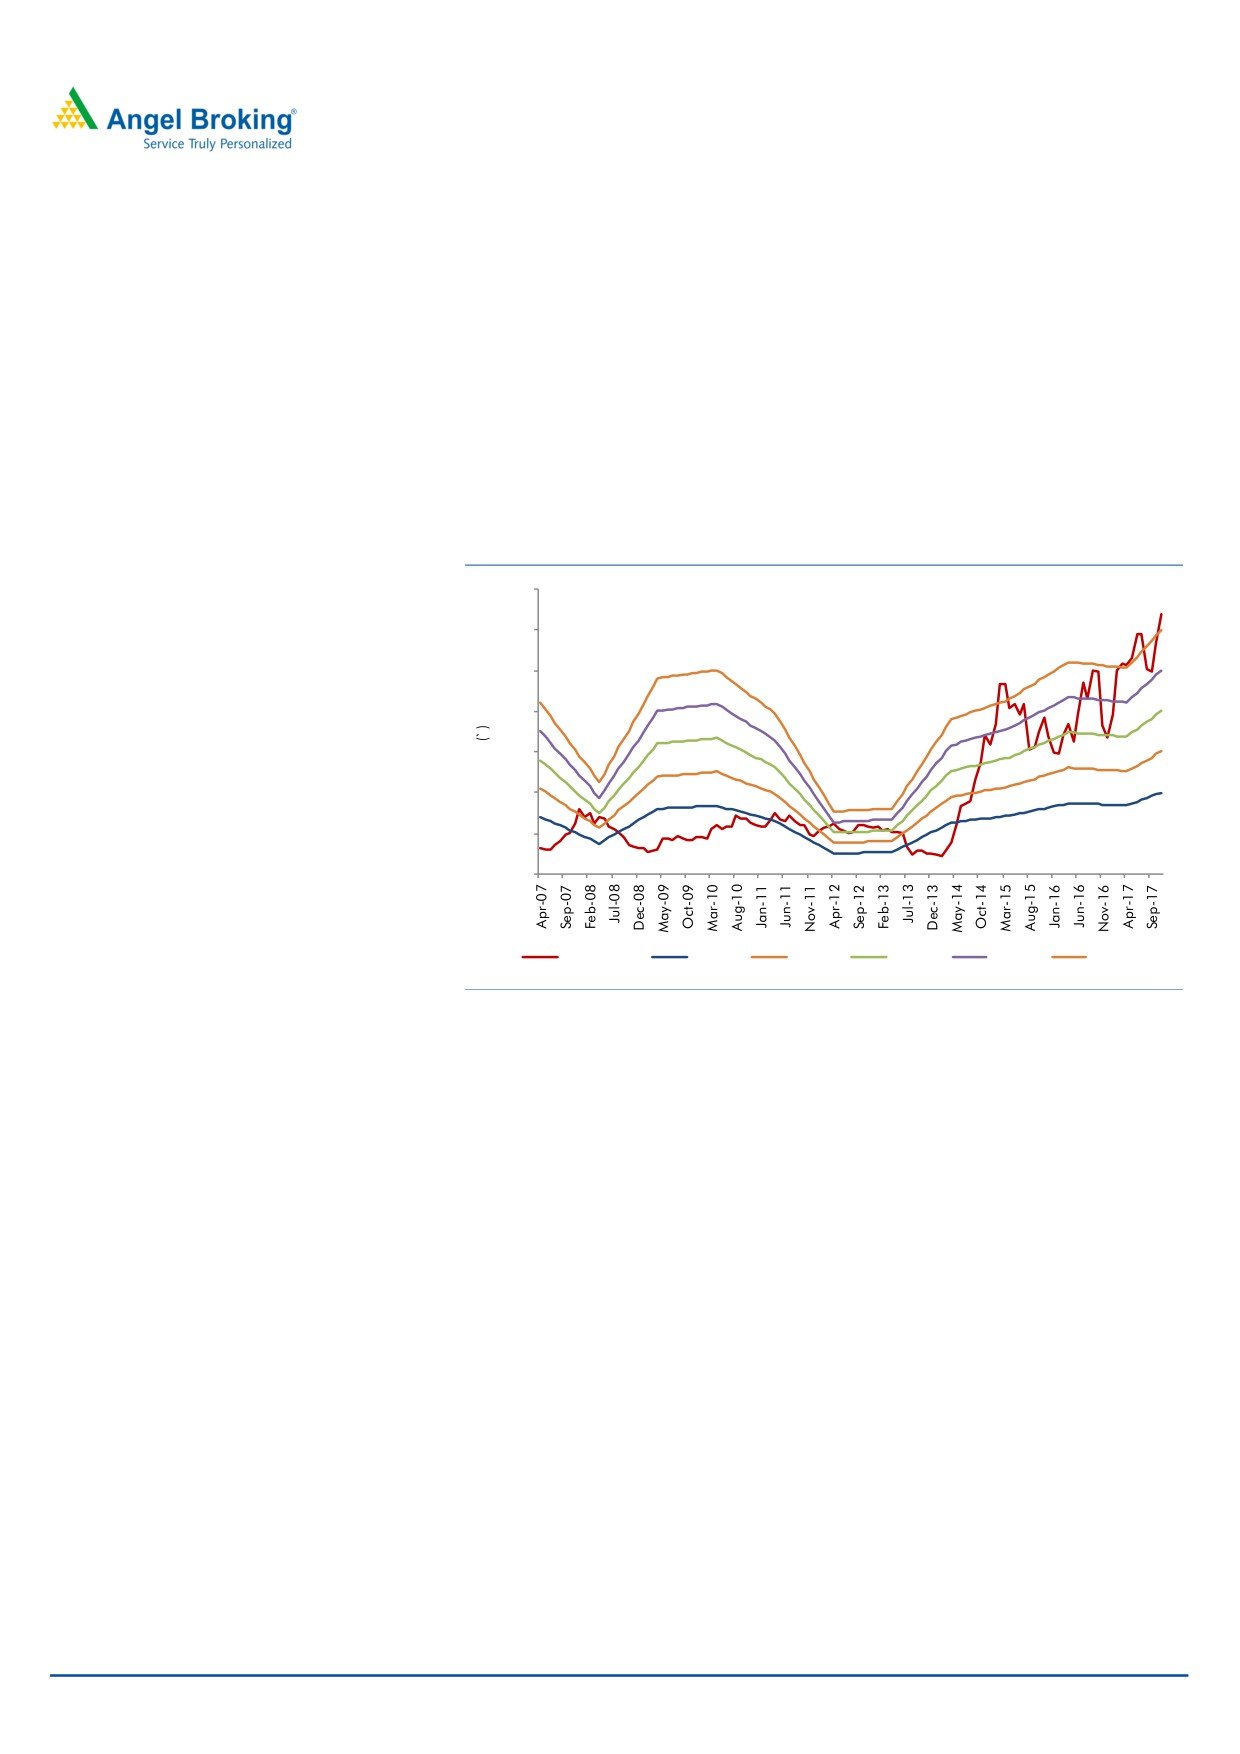
Exhibit 7: One year forward PE Chart
350
300
250
200
150
100
50
0
Share price
10.0 X
15.0 X
20.0 X
25.0 X
30.0 X
Source: Company, Angel Research
Downside risks to our estimates
Most of the company’s raw materials are imported from other counties and
also the company has ECB loan, any unfavorable change in currency may
pose forex risks, which could significantly impact margins.
Recently the company has added new MDF Plant with capex of `380cr, any
slowdown in MDF market can impact the company’s earnings due higher fixed
cost overheads.
November 28, 2017
5
Century Plyboards India| Initiating Coverage
Company Background
Century Plyboards (India) Ltd (CPIL) is a plywood manufacturer. The company's
segments include plywood, laminate, CFS services and others. The company's
geographical segments are India and overseas. The plywood segment includes
plywood, block-board, veneer and timber. The laminate segment includes
decorative laminates and pre-laminated boards. The CFS services segment
includes container freight station services. The others segment includes mainly
trading of chemicals, minerals, readymade furniture and equipments. The
company's product portfolio includes doors, decorative veneer, new age products
(NAP), fiber cement boards, particle boards, look book, slimline, mono core,
magnetic laminates and prelaminated boards. CPIL is also engaged in the logistics
business through the management of a container freight station. The Company's
units are spread across India in Joka (West Bengal), Guwahati (Assam), Kandla
(Gujarat), Chennai (Tamil Nadu) and Karnal (Haryana).
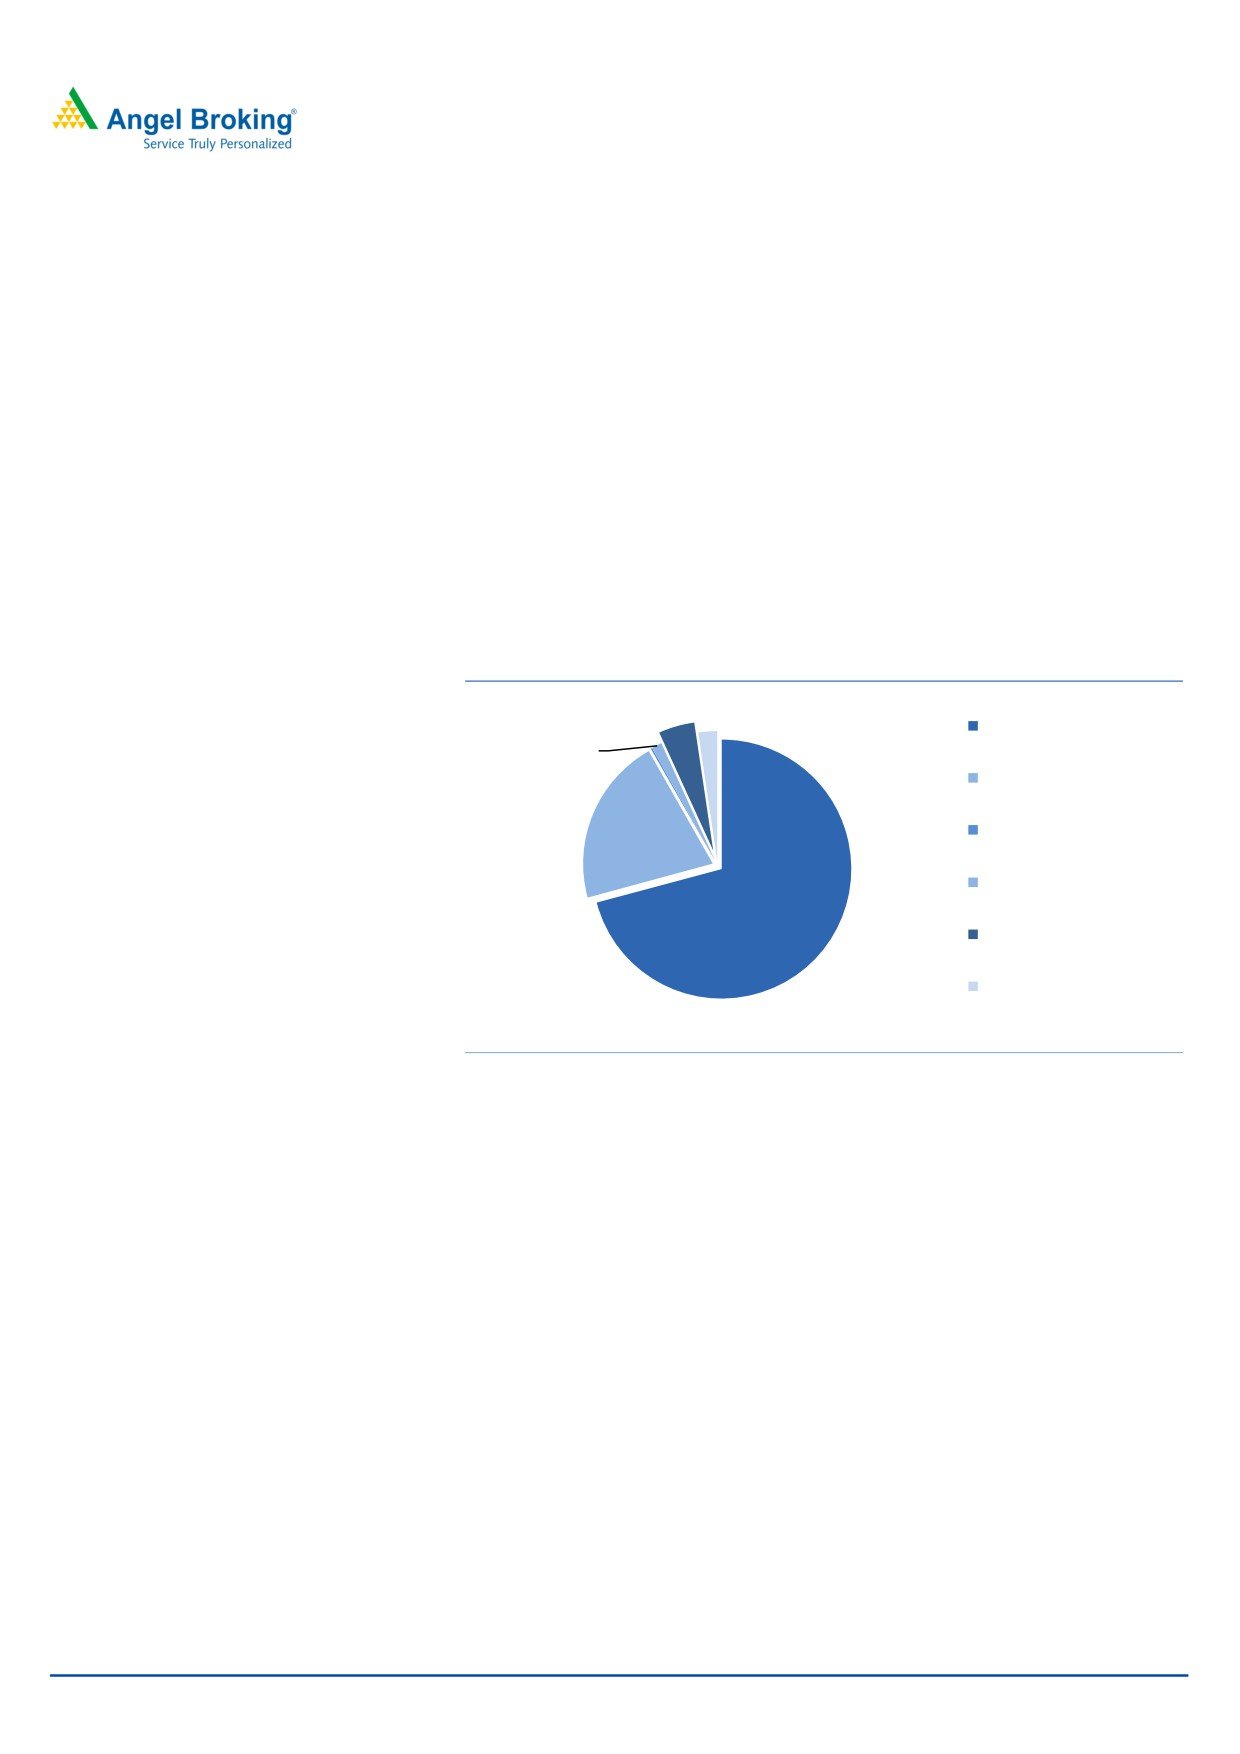
Exhibit 8: Revenue break-up for FY2017
4%
2%
Timber and Allied Product
0%
1%
Lamination and Allied
Product
21%
MDF
Particle Board
Logistic
71%
Others
Source: Company, Angel Research
November 28, 2017
6
Century Plyboards India| Initiating Coverage
Consolidated Profit & Loss Statement
Y/E March (` cr)
FY2015
FY2016
FY2017
FY2018E FY2019E FY2020E
Total operating income
1,588
1,641
1,819
2,007
2,510
2,896
% chg
17.9
3.3
10.8
10.4
25.1
15.4
Total Expenditure
1,318
1,351
1,507
1,656
2,061
2,372
Raw Material
843
819
895
987
1,235
1,425
Personnel
201
236
273
307
389
455
Others Expenses
275
296
339
361
437
492
EBITDA
270
289
312
351
449
524
% chg
70.8
7.1
7.8
12.6
27.9
16.6
(% of Net Sales)
17.0
17.6
17.2
17.5
17.9
18.1
Depreciation& Amortisation
48
47
59
67
75
77
EBIT
222
242
253
284
374
447
% chg
85.6
9.1
4.4
12.6
31.6
19.5
(% of Net Sales)
14.0
14.7
13.9
14.2
14.9
15.4
Interest & other Charges
46
48
30
55
70
70
Other Income
3
6
23
8
9
10
(% of PBT)
1.8
3.0
9.2
3.4
2.9
2.6
Share in profit of Associates
-
-
-
-
-
-
Recurring PBT
180
200
245
238
314
387
% chg
185.6
11.5
22.4
(2.9)
31.9
23.4
Tax
30
30
52
50
66
81
(% of PBT)
16.5
15.2
21.0
21.0
21.0
21.0
PAT (reported)
150
170
193
188
248
306
Minority Interest (after tax)
1
-
-
-
-
-
Profit/Loss of Associate Company
(0)
-
-
-
-
-
ADJ. PAT
149
170
193
188
248
306
% chg
147.2
13.9
14.0
(2.9)
31.9
23.4
(% of Net Sales)
9.4
10.3
10.6
9.4
9.9
10.6
Basic EPS (`)
6.7
7.6
8.7
8.4
11.1
13.7
Fully Diluted EPS (`)
6.7
7.6
8.7
8.4
11.1
13.7
% chg
147.2
13.9
14.0
(2.9)
31.9
23.4
November 28, 2017
7
Century Plyboards India| Initiating Coverage
Consolidated Balance Sheet
Y/E March (` cr)
FY2015
FY2016
FY2017 FY2018E FY2019E FY2020E
SOURCES OF FUNDS
Equity Share Capital
22
22
22
22
22
22
Reserves& Surplus
367
507
693
858
1,062
1,312
Shareholders Funds
389
529
715
881
1,084
1,334
Minority Interest
6
9
12
12
12
12
Total Loans
514
474
619
780
770
770
Deferred Tax Liability
1
1
1
1
1
1
Total Liabilities
909
1,013
1,347
1,674
1,867
2,118
APPLICATION OF FUNDS
Gross Block
461
298
412
924
948
973
Less: Acc. Depreciation
215
48
106
173
248
325
Net Block
246
250
306
751
700
648
Capital Work-in-Progress
33
102
299
299
299
299
Investments
0
6
6
6
6
6
Current Assets
782
751
905
836
1,139
1,480
Inventories
332
298
301
330
426
500
Sundry Debtors
268
284
342
379
488
571
Cash
37
39
67
34
46
96
Loans & Advances
79
90
160
60
138
261
Other Assets
65
39
35
32
40
52
Current liabilities
158
162
238
286
345
385
Net Current Assets
624
588
667
549
793
1,095
Deferred Tax Asset
7
66
69
69
69
69
Mis. Exp. not written off
-
-
-
-
-
-
Total Assets
909
1,013
1,347
1,674
1,867
2,118
November 28, 2017
8
Century Plyboards India| Initiating Coverage
Consolidated Cashflow Statement
Y/E March (` cr)
FY2015 FY2016 FY2017 FY2018E FY2019E FY2020E
Profit before tax
180
200
245
238
314
387
Depreciation
48
47
59
67
75
77
Change in Working Capital
(88)
34
(54)
84
(232)
(251)
Interest / Dividend (Net)
44
47
30
55
70
70
Direct taxes paid
(34)
(47)
(43)
(50)
(66)
(81)
Others
(2)
10
(17)
0
0
0
Cash Flow from Operations
149
293
221
394
160
202
(Inc.)/ Dec. in Fixed Assets
7
(150)
(305)
(512)
(24)
(25)
(Inc.)/ Dec. in Investments
6
11
0
0
0
0
Cash Flow from Investing
13
(139)
(304)
(512)
(24)
(25)
Issue of Equity
0
0
0
0
0
0
Inc./(Dec.) in loans
(65)
(44)
142
162
(10)
0
Dividend Paid (Incl. Tax)
(39)
(50)
(0)
(22)
(45)
(56)
Interest / Dividend (Net)
(54)
(59)
(30)
(55)
(70)
(70)
Cash Flow from Financing
(158)
(153)
112
85
(124)
(126)
Inc./(Dec.) in Cash
4
1
28
(33)
12
51
Opening Cash balances
33
37
39
67
34
46
Closing Cash balances
37
39
67
34
46
96
November 28, 2017
9
Century Plyboards India| Initiating Coverage
Key ratios
Y/E March
FY2015 FY2016 FY2017FY2018EFY2019EFY2020E
Valuation Ratio (x)
P/E (on FDEPS)
47.3
41.5
36.4
37.5
28.4
23.0
P/CEPS
35.5
32.4
27.9
27.6
21.8
18.4
P/BV
18.1
13.3
9.9
8.0
6.5
5.3
Dividend yield (%)
0.6
0.7
0.8
0.3
0.6
0.8
EV/Sales
4.7
4.6
4.2
3.9
3.1
2.7
EV/EBITDA
27.8
25.8
24.3
22.2
17.3
14.7
EV / Total Assets
8.3
7.4
5.6
4.6
4.2
3.6
Per Share Data (Rs)
EPS (Basic)
6.7
7.6
8.7
8.4
11.1
13.7
EPS (fully diluted)
6.7
7.6
8.7
8.4
11.1
13.7
Cash EPS
8.9
9.8
11.4
11.4
14.5
17.2
DPS
2.0
2.2
2.5
1.0
2.0
2.5
Book Value
17.5
23.8
32.1
39.6
48.7
60.0
Returns (%)
ROCE
24.6
24.1
18.9
17.1
20.2
21.3
Angel ROIC (Pre-tax)
25.6
25.3
20.0
17.6
20.8
22.3
ROE
38.3
32.1
27.1
21.3
22.9
22.9
Turnover ratios (x)
Asset Turnover (Gross Block)
3.4
5.5
4.4
2.2
2.6
3.0
Inventory / Sales (days)
76
66
60
60
62
63
Receivables (days)
62
63
69
69
71
72
Payables (days)
14
19
28
31
31
31
Working capital cycle (ex-cash) (days)
124
110
101
98
102
104
November 28, 2017
10
Century Plyboards India| Initiating Coverage
Research Team Tel: 022 - 39357800
DISCLAIMER
Angel Broking Private Limited (hereinafter referred to as “Angel”) is a registered Member of National Stock Exchange of India Limited,
Bombay Stock Exchange Limited and Metropolitan Stock Exchange Limited. It is also registered as a Depository Participant with CDSL
and Portfolio Manager with SEBI. It also has registration with AMFI as a Mutual Fund Distributor. Angel Broking Private Limited is a
registered entity with SEBI for Research Analyst in terms of SEBI (Research Analyst) Regulations, 2014 vide registration number
INH000000164. Angel or its associates has not been debarred/ suspended by SEBI or any other regulatory authority for accessing
/dealing in securities Market. Angel or its associates/analyst has not received any compensation / managed or co-managed public
offering of securities of the company covered by Analyst during the past twelve months.
This document is solely for the personal information of the recipient, and must not be singularly used as the basis of any investment
decision. Nothing in this document should be construed as investment or financial advice. Each recipient of this document should
make such investigations as they deem necessary to arrive at an independent evaluation of an investment in the securities of the
companies referred to in this document (including the merits and risks involved), and should consult their own advisors to determine
the merits and risks of such an investment.
Reports based on technical and derivative analysis center on studying charts of a stock's price movement, outstanding positions and
trading volume, as opposed to focusing on a company's fundamentals and, as such, may not match with a report on a company's
fundamentals. Investors are advised to refer the Fundamental and Technical Research Reports available on our website to evaluate the
contrary view, if any.
The information in this document has been printed on the basis of publicly available information, internal data and other reliable
sources believed to be true, but we do not represent that it is accurate or complete and it should not be relied on as such, as this
document is for general guidance only. Angel Broking Pvt. Limited or any of its affiliates/ group companies shall not be in any way
responsible for any loss or damage that may arise to any person from any inadvertent error in the information contained in this report.
Angel Broking Pvt. Limited has not independently verified all the information contained within this document. Accordingly, we cannot
testify, nor make any representation or warranty, express or implied, to the accuracy, contents or data contained within this document.
While Angel Broking Pvt. Limited endeavors to update on a reasonable basis the information discussed in this material, there may be
regulatory, compliance, or other reasons that prevent us from doing so.
This document is being supplied to you solely for your information, and its contents, information or data may not be reproduced,
redistributed or passed on, directly or indirectly.
Neither Angel Broking Pvt. Limited, nor its directors, employees or affiliates shall be liable for any loss or damage that may arise from
or in connection with the use of this information.
Disclosure of Interest Statement
Century Plyboards India
1. Financial interest of research analyst or Angel or his Associate or his relative
No
2. Ownership of 1% or more of the stock by research analyst or Angel or associates or relatives
No
3. Served as an officer, director or employee of the company covered under Research
No
4. Broking relationship with company covered under Research
No
Ratings (Based on expected returns
Buy (> 15%)
Accumulate (5% to 15%)
Neutral (-5 to 5%)
over 12 months investment period):
Reduce (-5% to -15%)
Sell (< -15)
November 28, 2017
11